Windows Digital Forensics: Essential Analysis Tools and Techniques
Overview
This comprehensive guide focuses on essential tools and methodologies used in Windows Digital Forensics and Incident Response (DFIR). Rather than analyzing a specific attack, we’ll explore the systematic application of forensic tools and when to leverage them effectively in an investigation.
Prerequisites
Training Resources
Required Tools
- Eric Zimmerman’s Forensic Tools
- Additional tools available at Blue Cape Security (mid-page)
Analysis Methodology
Priority Order
- Windows Event Logs
- Windows Registry
- NTFS Analysis
- Additional Windows Artifacts
Registry Analysis
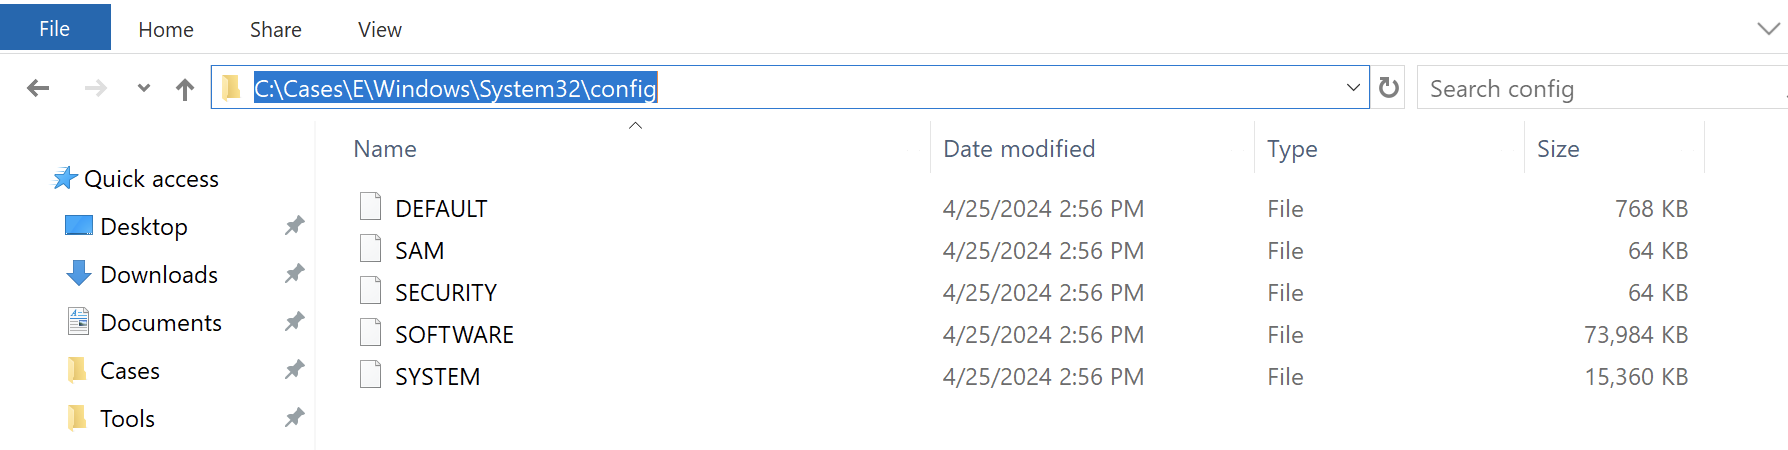
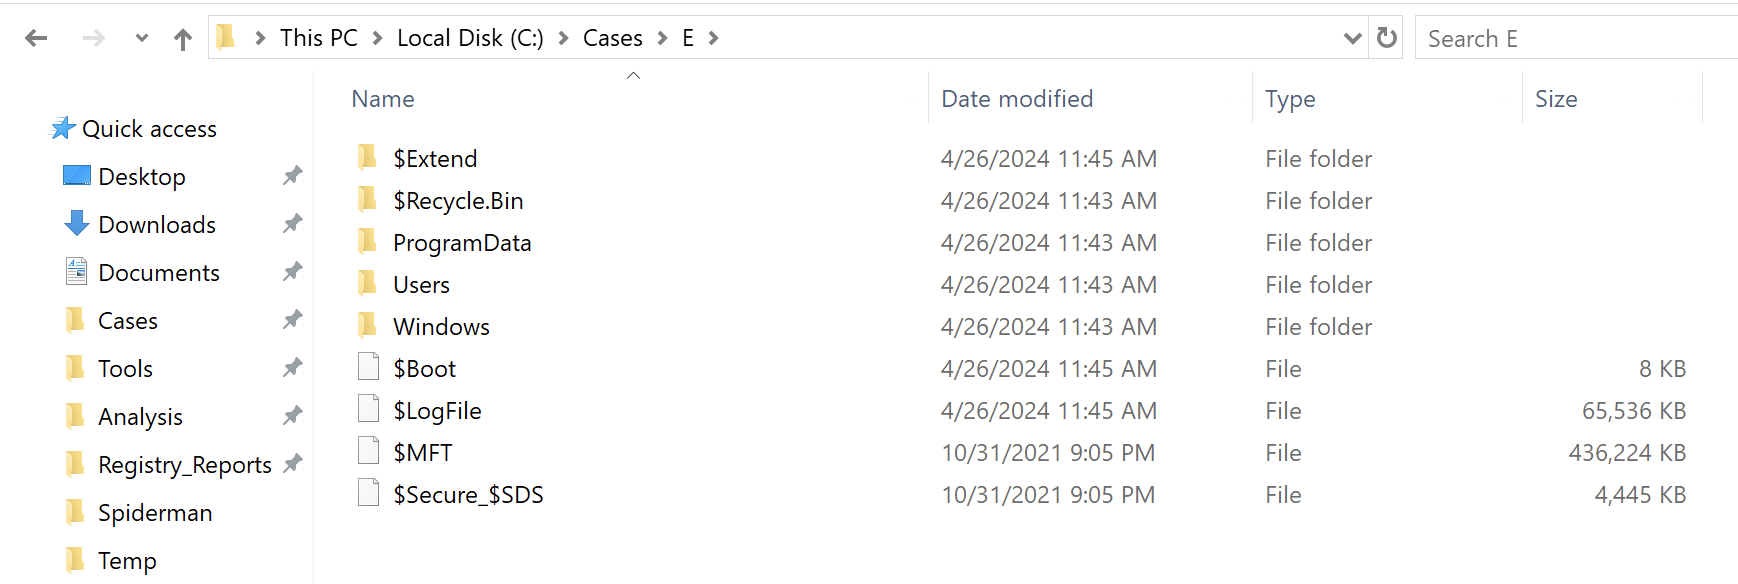
Registry Hive Locations
C:\Cases\E\Windows\System32\config
C:\Cases\E\Users\tstark\NTUSER.DAT
C:\Cases\E\Users\tstark\AppData\Local\Microsoft\Windows\Usr\Class.dat
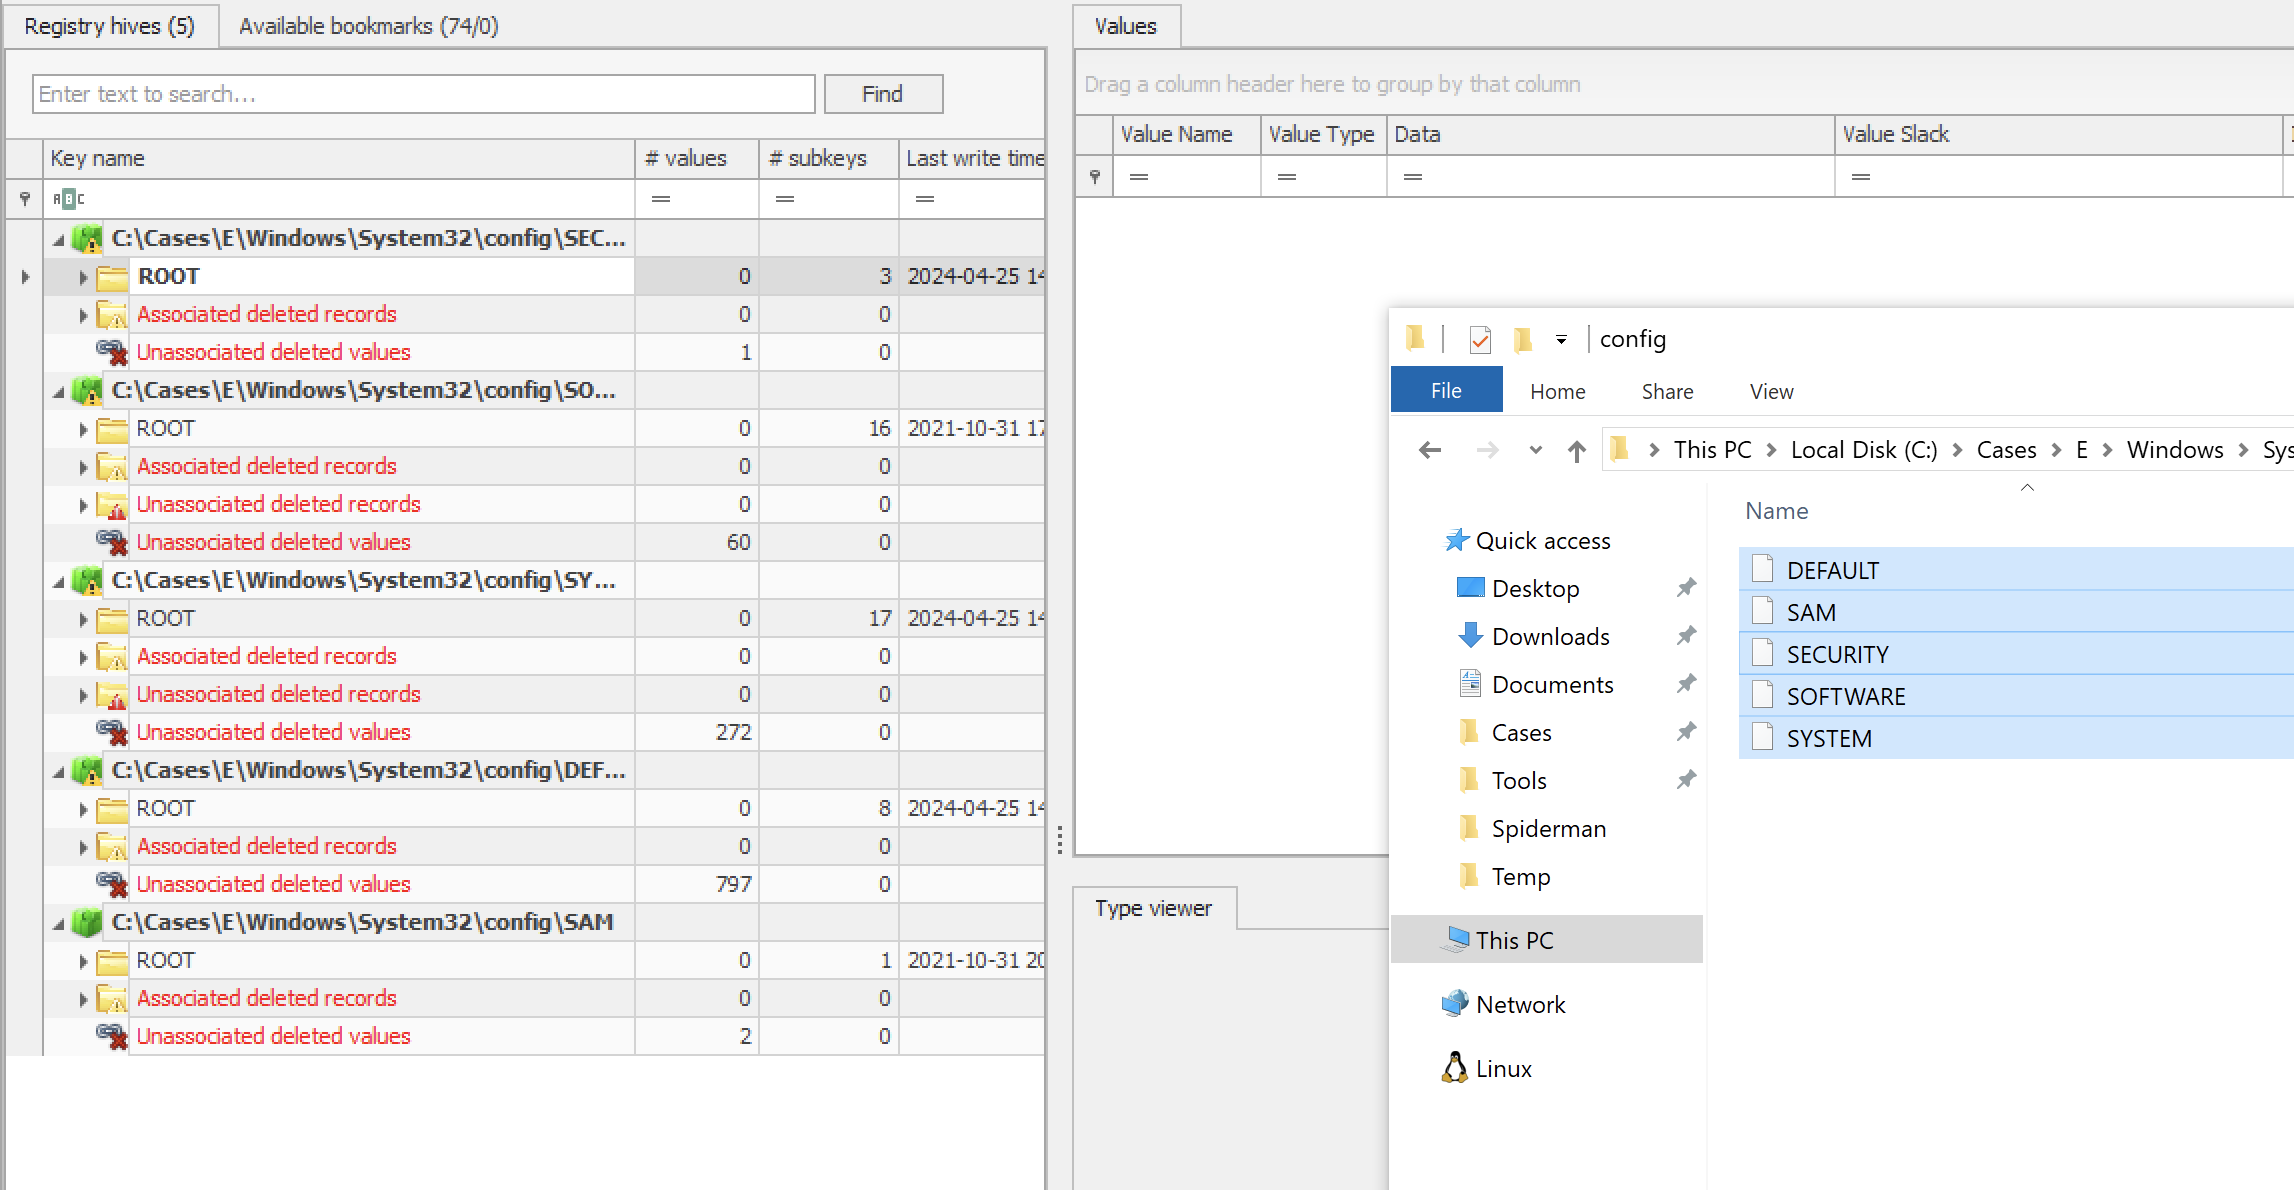
Using Registry Explorer
-
Import Registry Hives
-
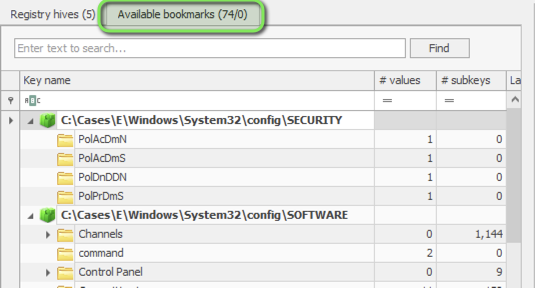
Utilize Available Bookmarks for Common Analysis Points
RegRipper Analysis
RegRipper provides automated registry analysis capabilities. Reference: Plugin Matrix
Single Hive Analysis
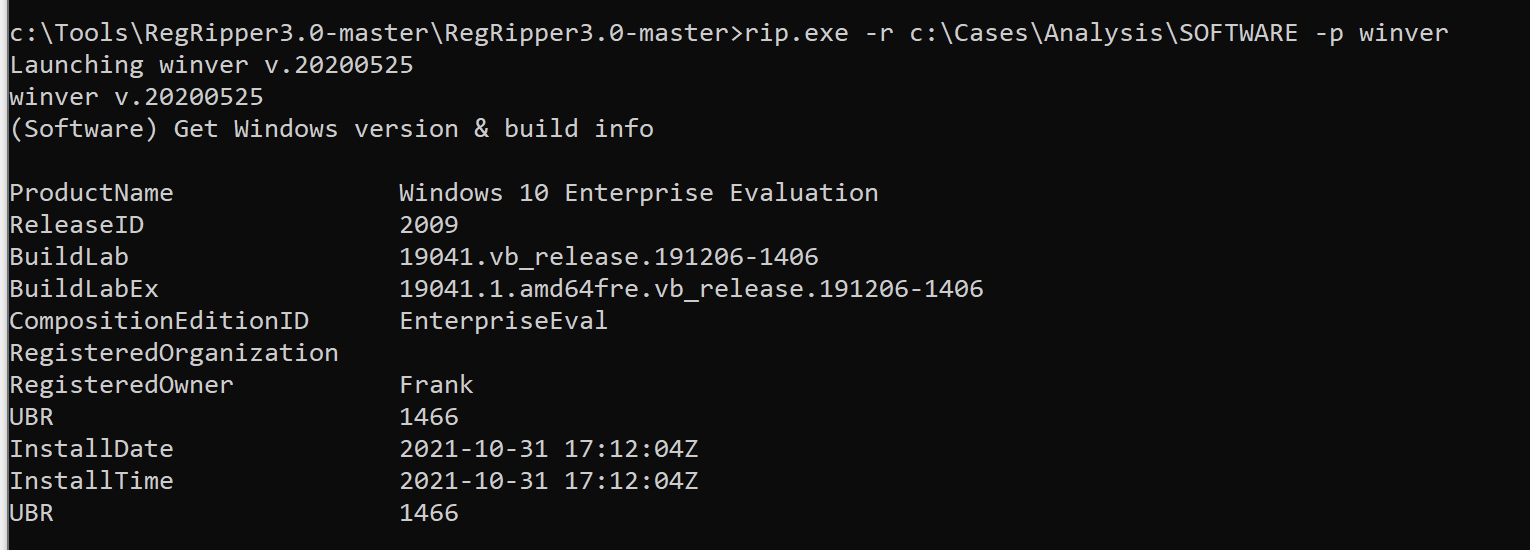
# Extract Windows version information
rip.exe -r C:\Cases\Analysis\SOFTWARE -p winver
Bulk Hive Analysis
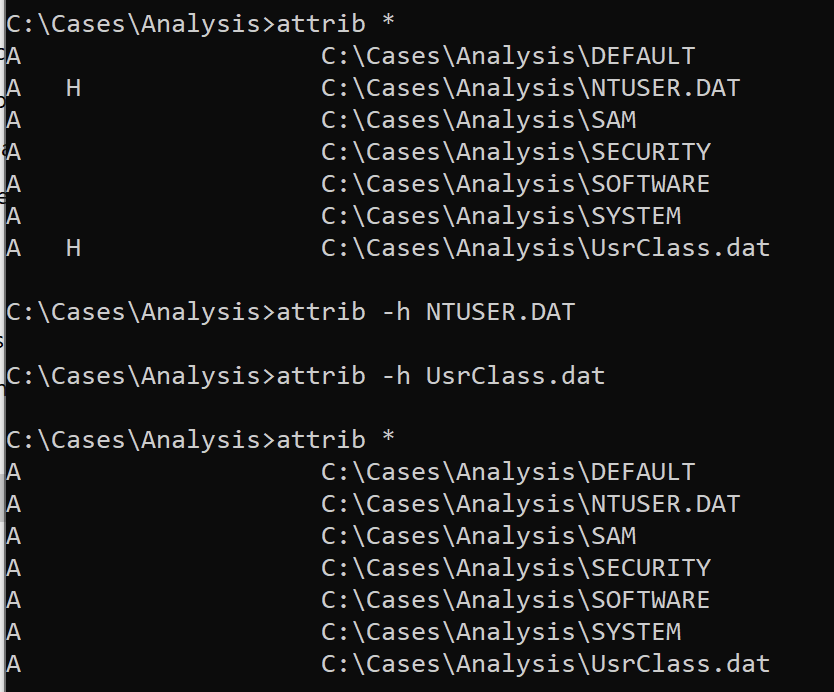
- Prepare Hidden Files
# View file attributes
attrib *

# Make hidden files accessible
attrib -h UsrClass.dat
attrib -h NTUSER.dat
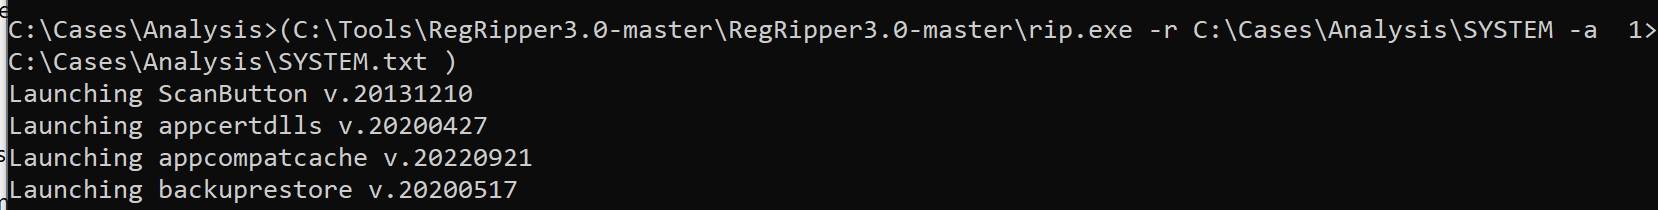
- Process Multiple Hives
for /r %i in (*) do (C:\Tools\RegRipper\rip.exe -r %i -a > %i.txt)
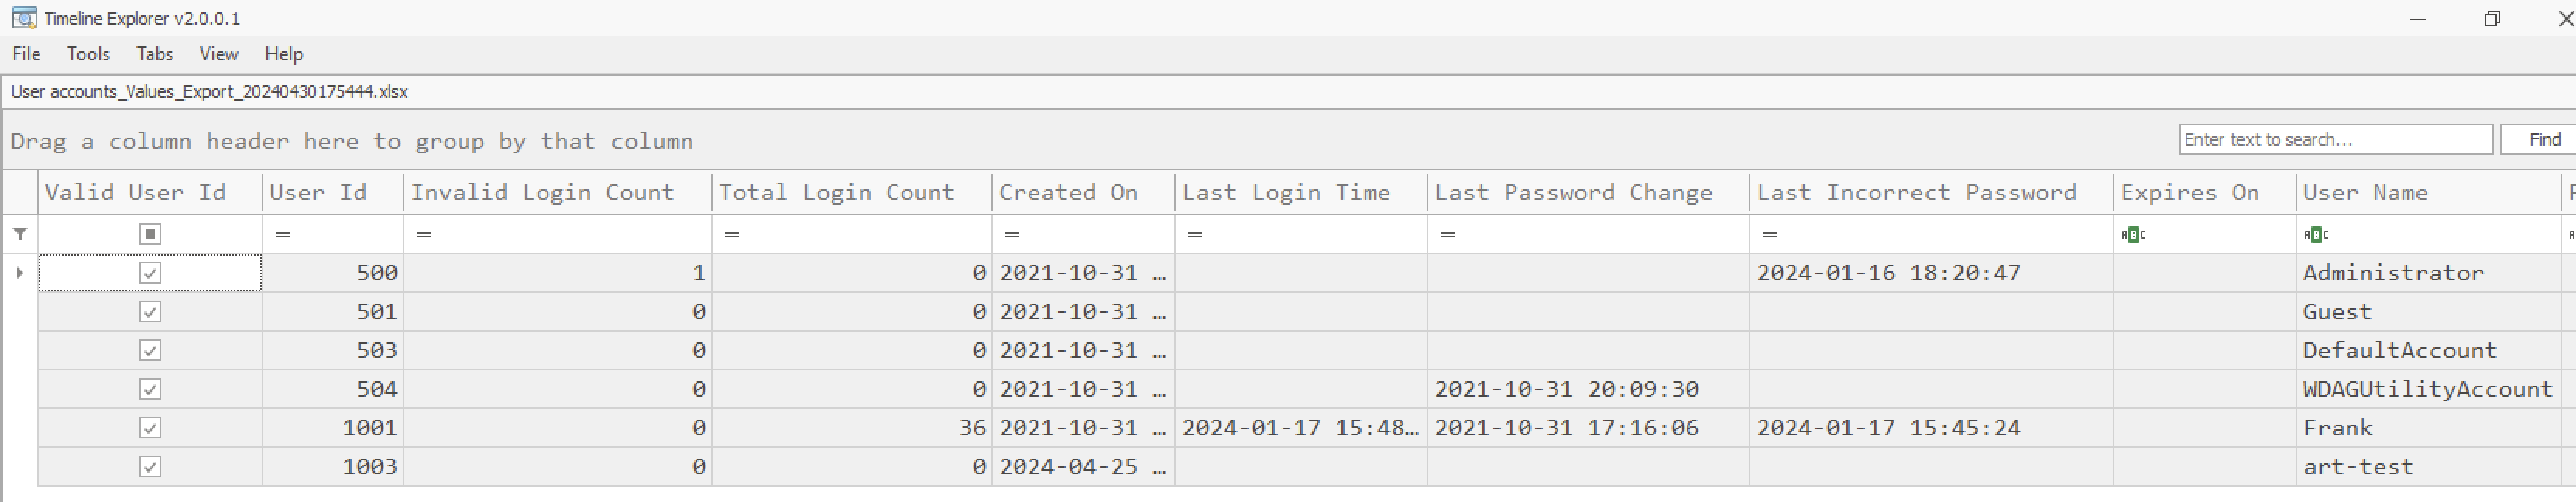
User Account Analysis
-
Export SAM Database using Registry Explorer
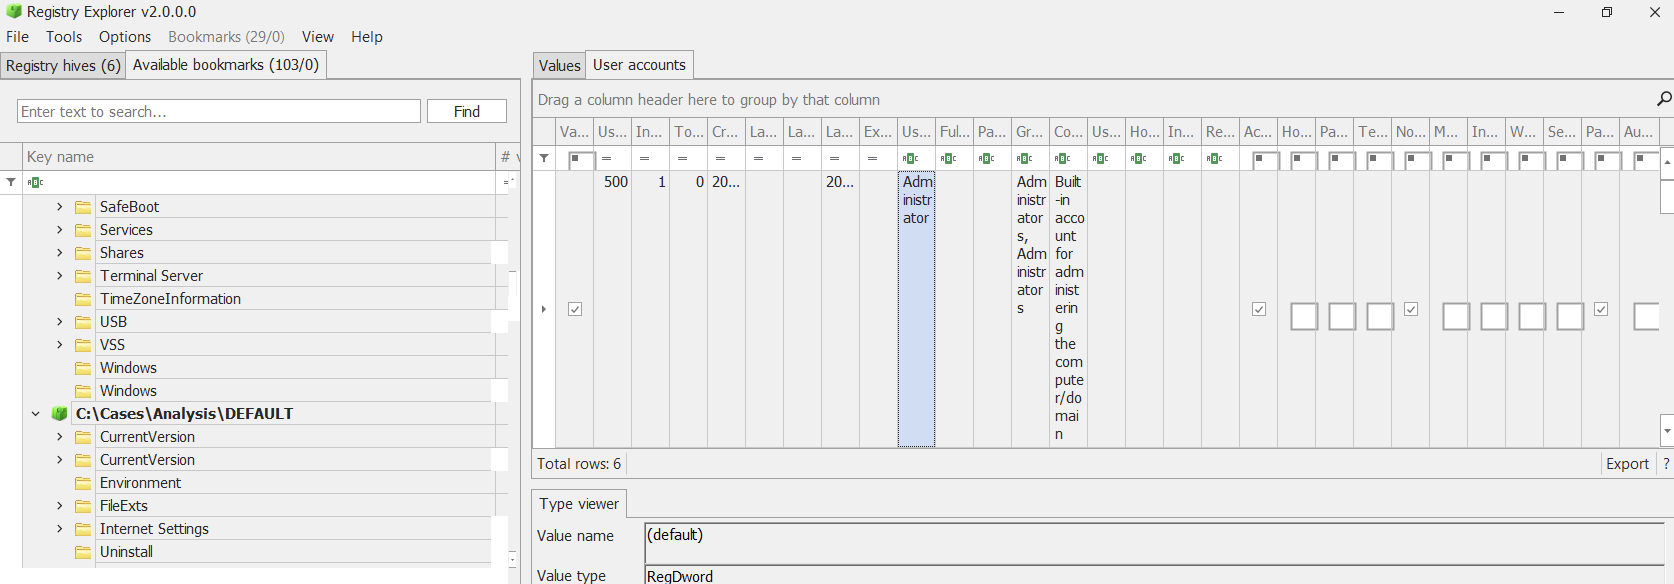
-
Analyze with Timeline Explorer
User Behavior Analysis
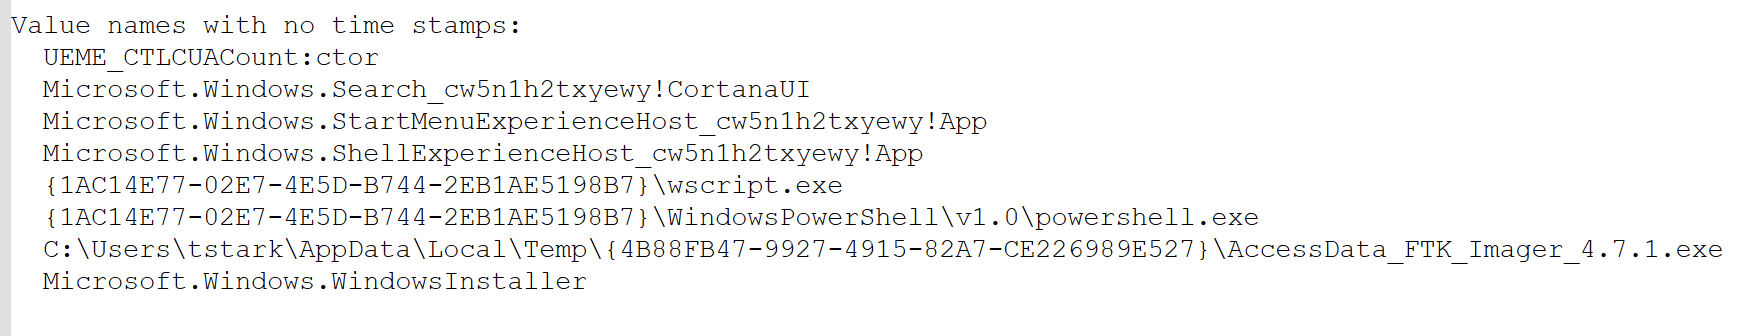
UserAssist Analysis
Location: NTUSER.DAT
Purpose: Tracks recently used applications
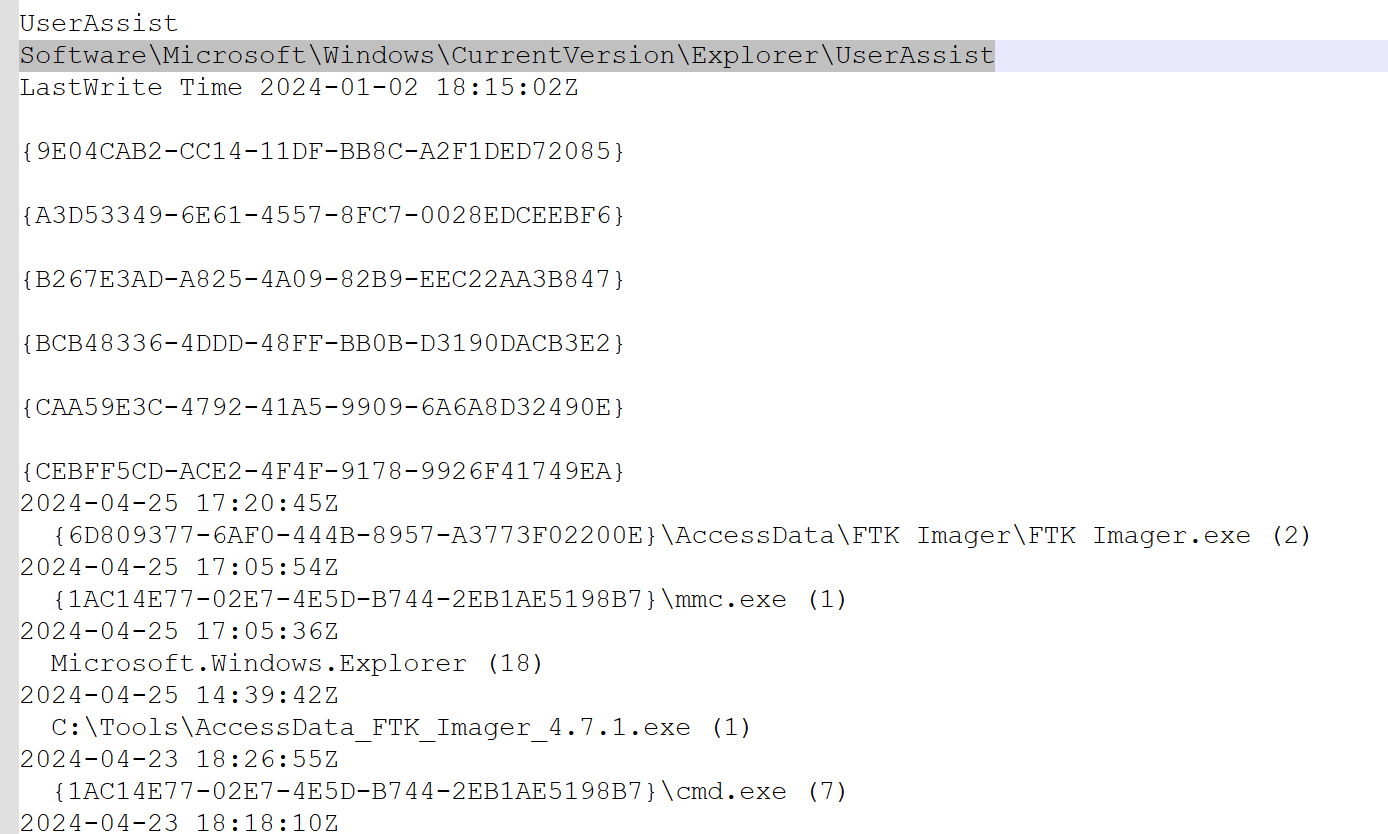
Additional metadata in value names:
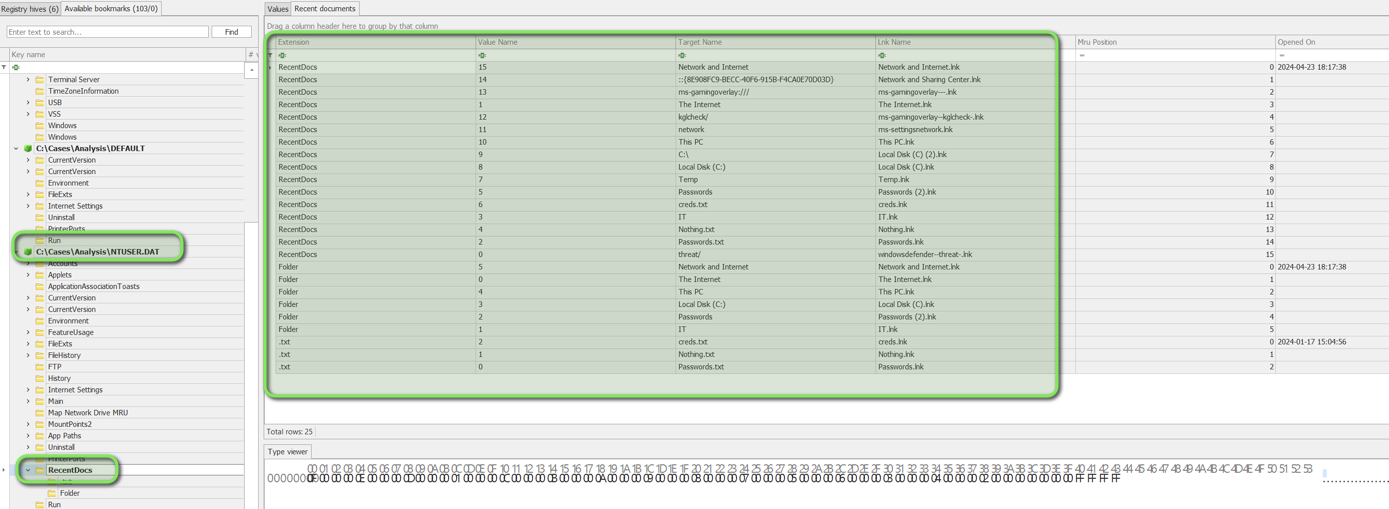
Recent Documents
Location: NTUSER.DAT
Analysis Tool: Registry Explorer
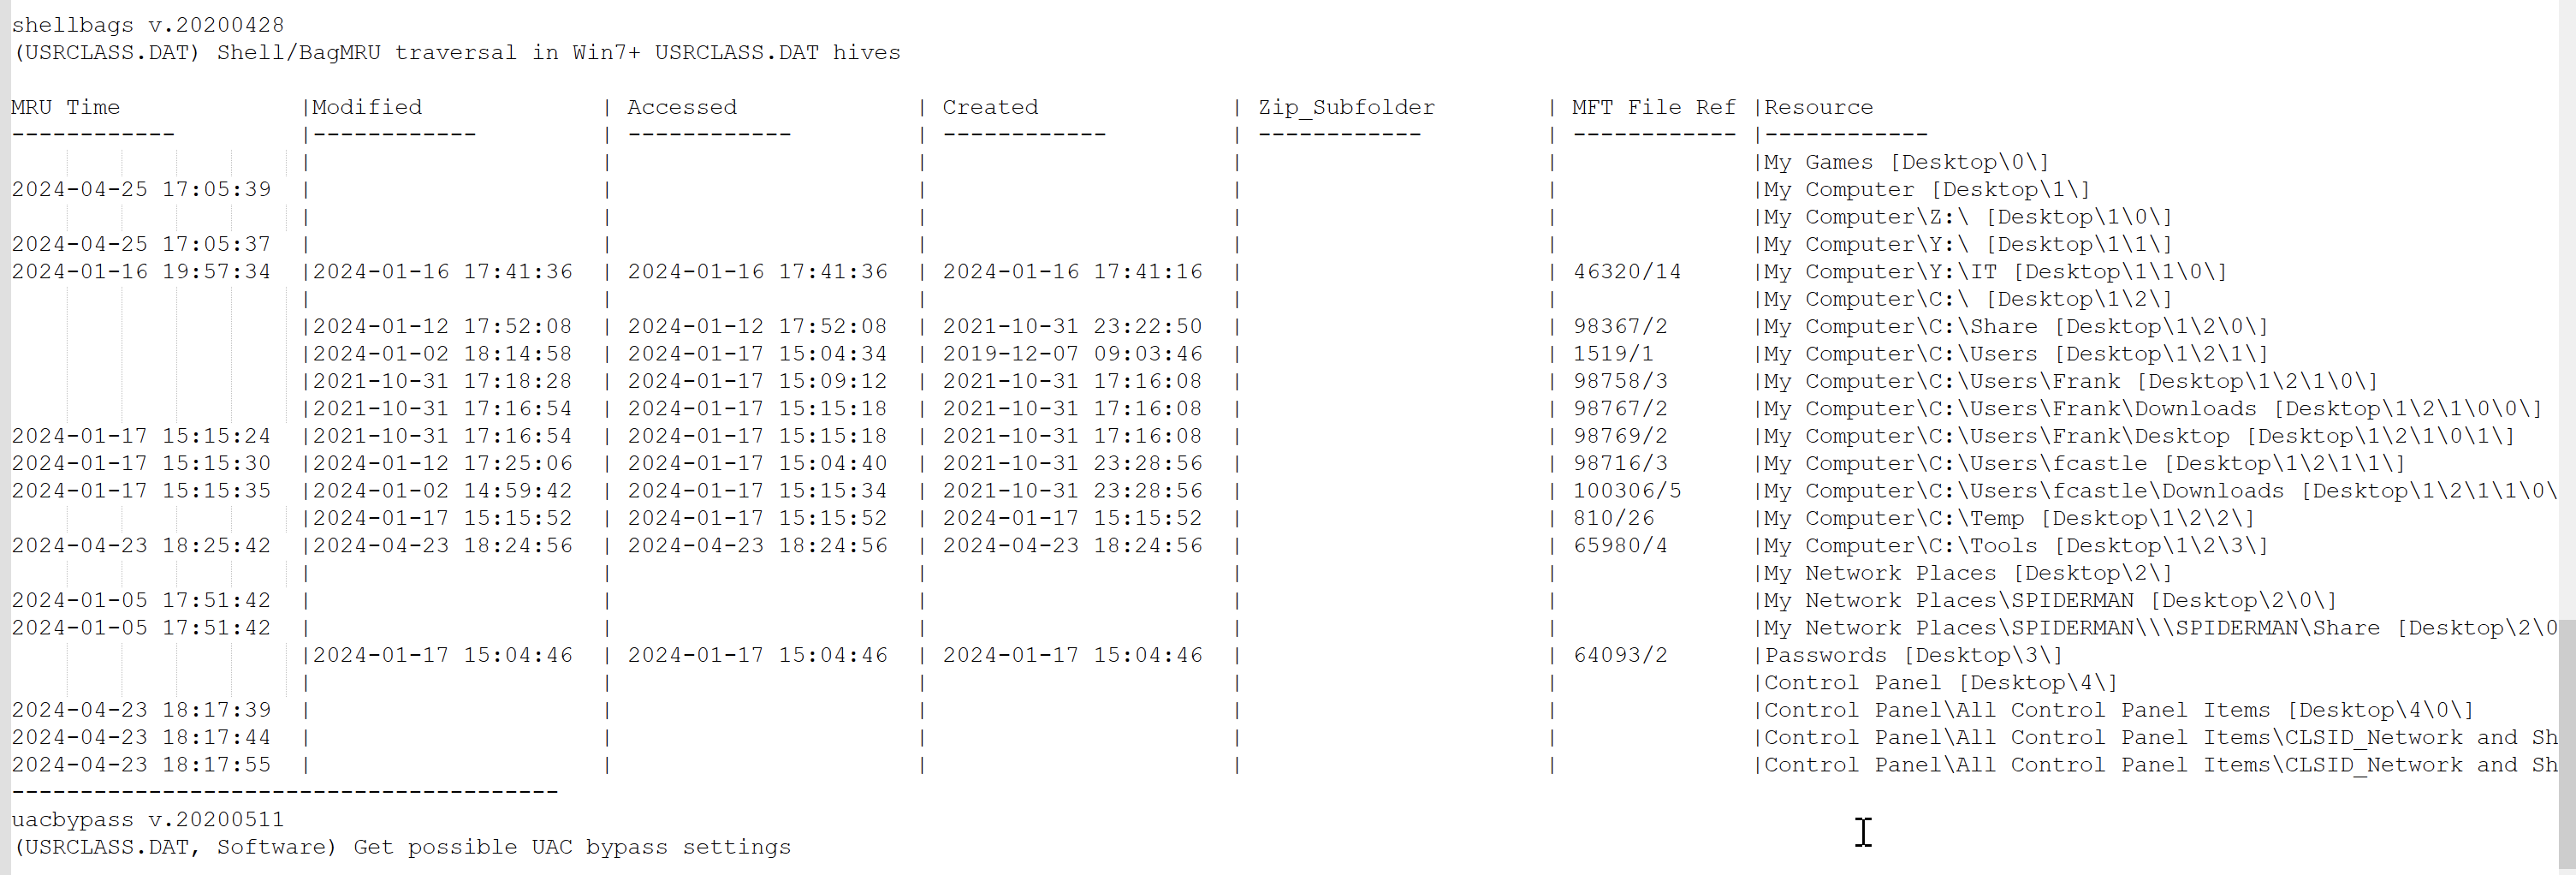
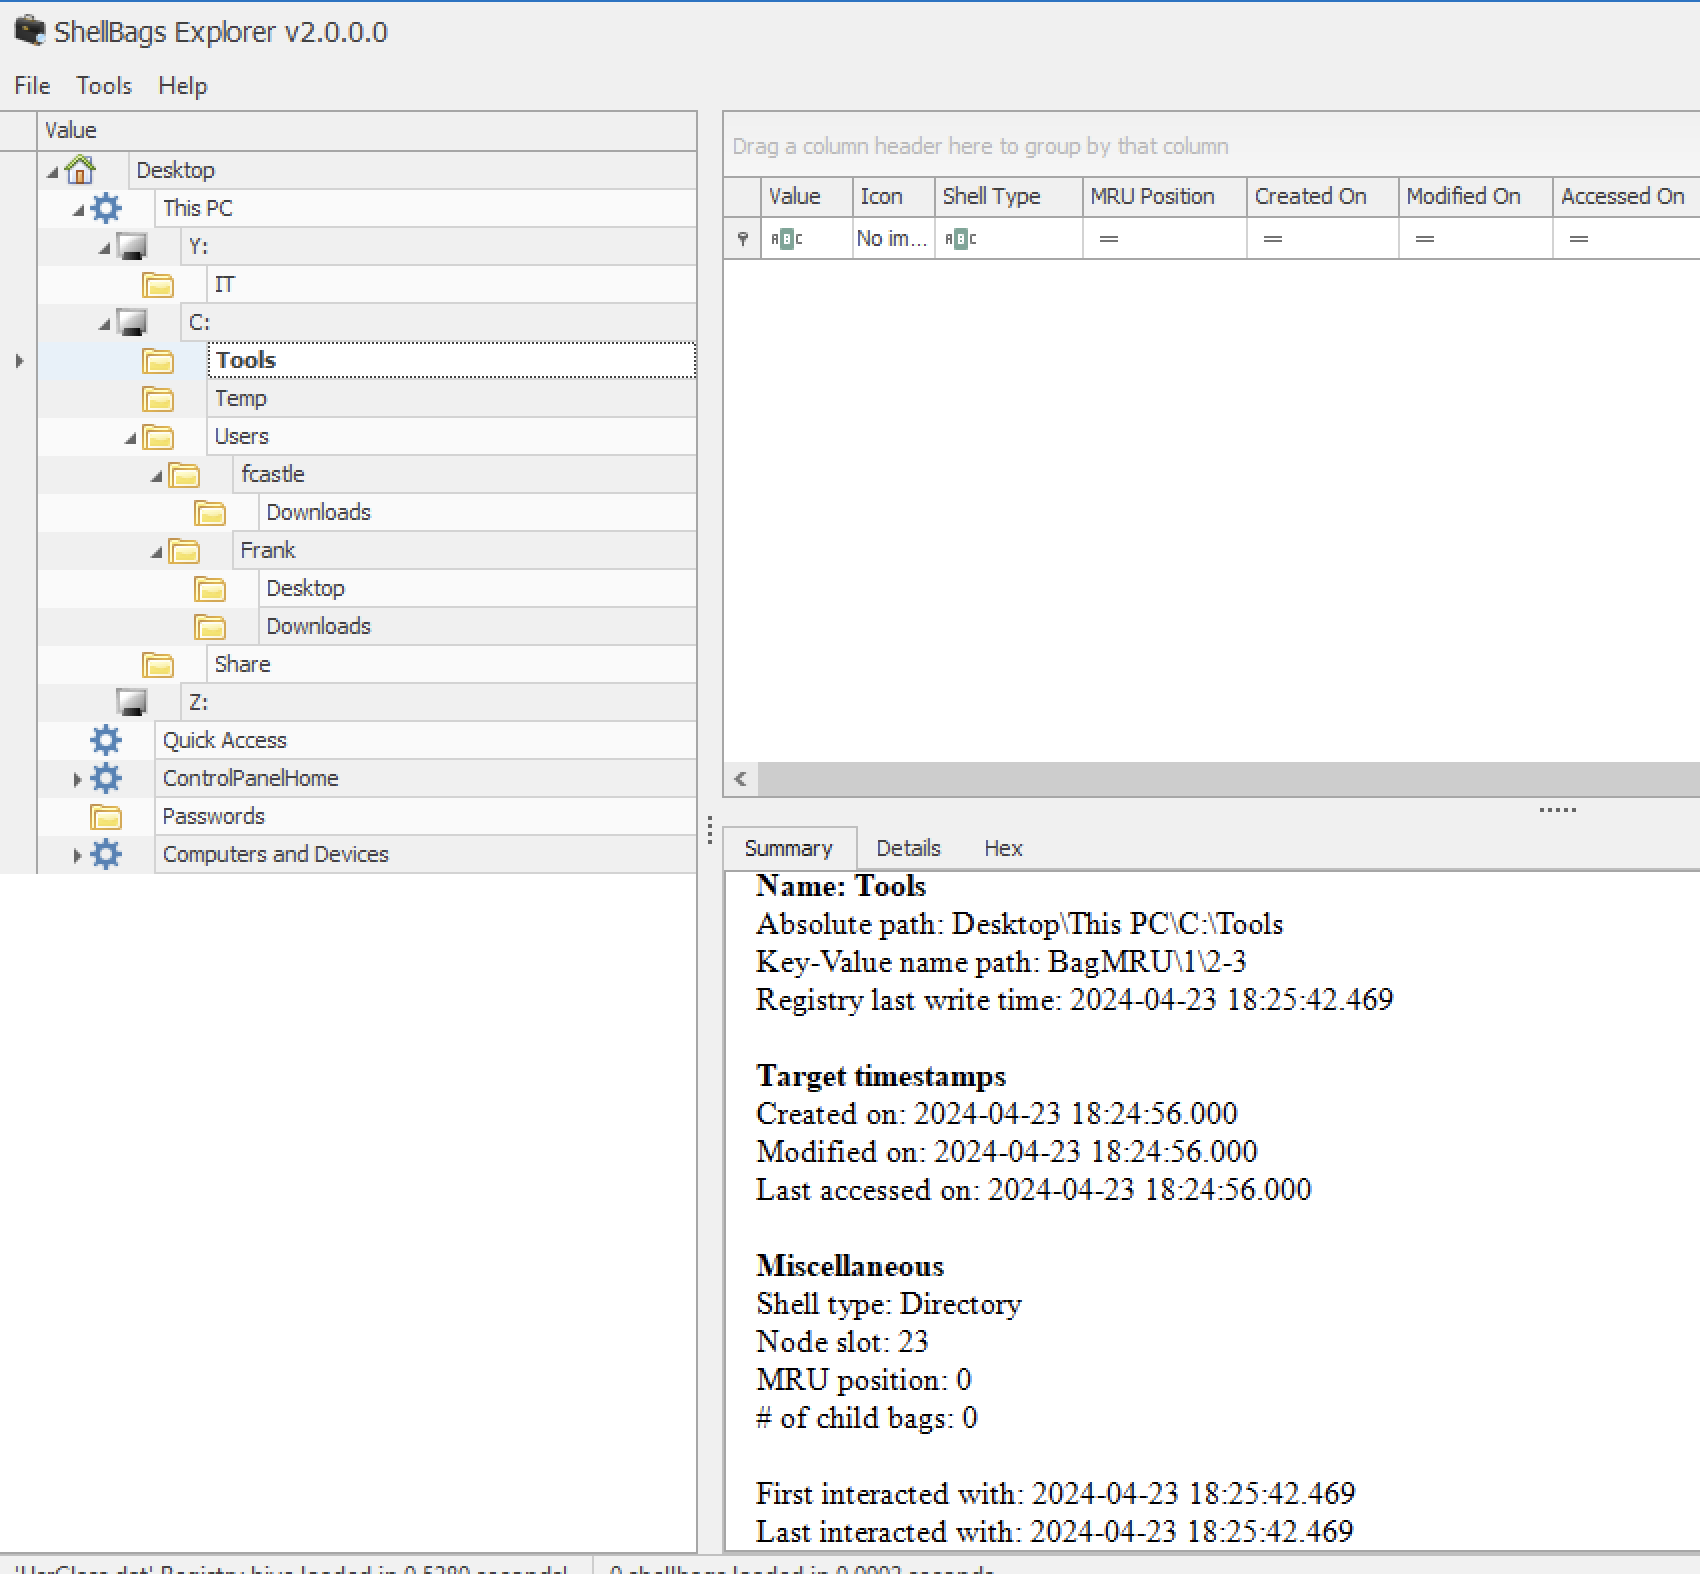
ShellBags Analysis
Location: UserClass.dat Purpose: Track folder access history
-
Registry Explorer View:
-
ShellBagsExplorer Analysis:
NTFS Analysis
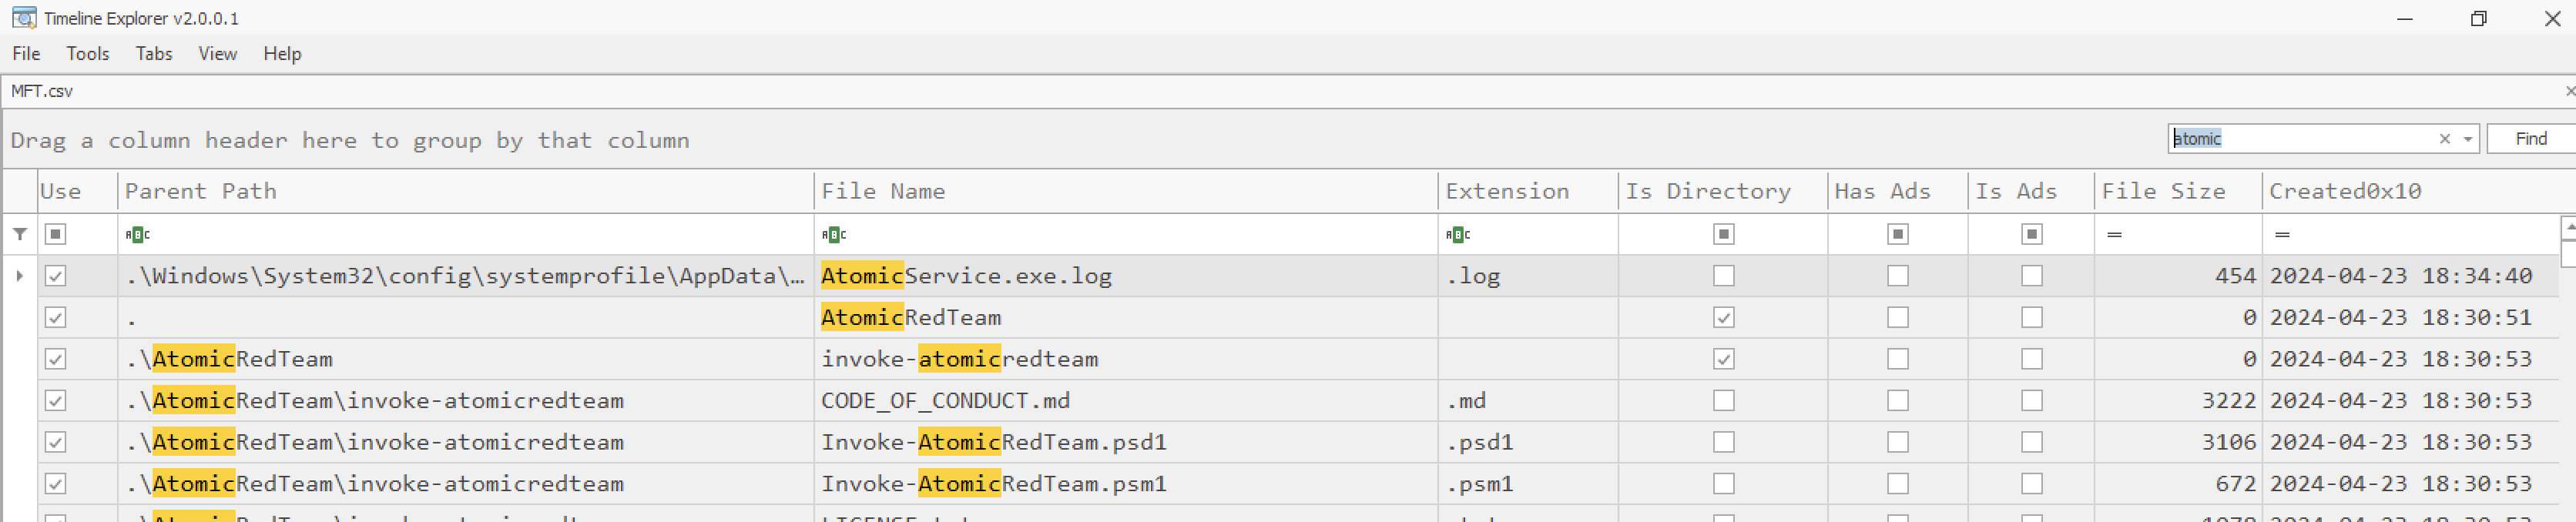
MFT Analysis
Using MFTECmd.exe:
MFTECmd.exe -f c:\cases\E\$MFT --csv C:\Cases\Analysis\NFTS\ --csvf MFT.csv
Timeline Explorer Analysis:
Timestamp Analysis:

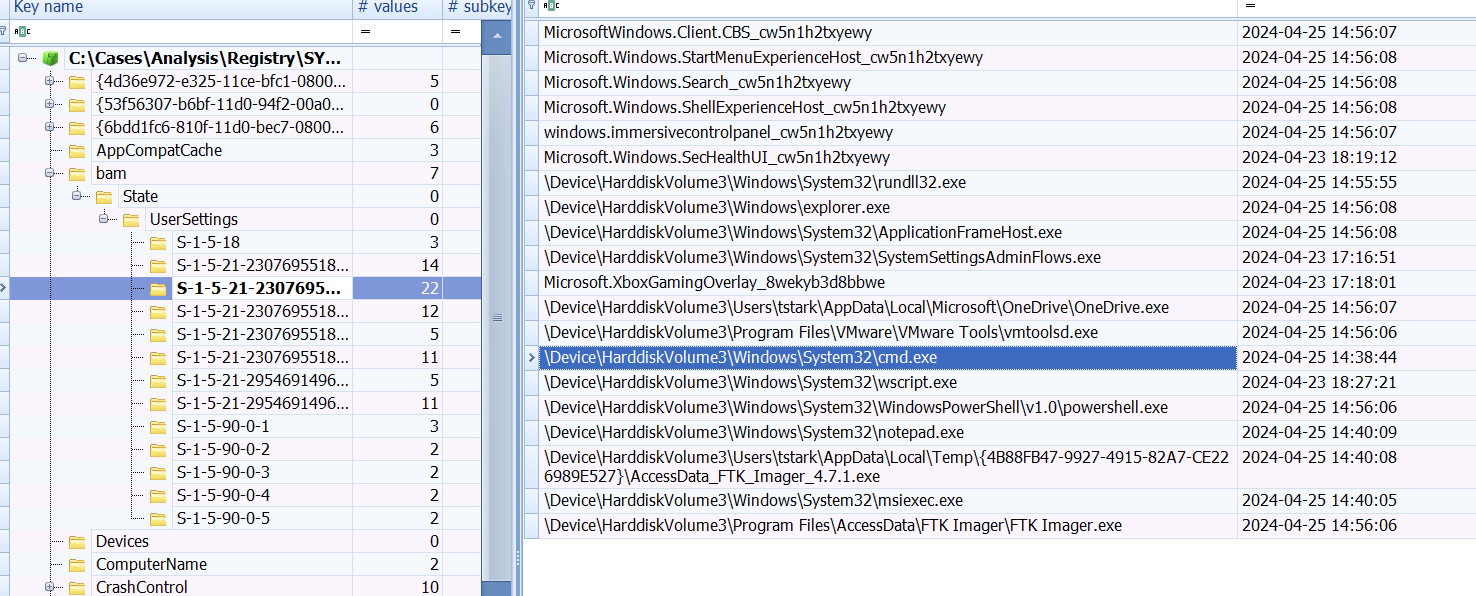
Program Execution Analysis
Background Activity Moderator (BAM)
Location: SYSTEM hive
Purpose: Track recently executed programs
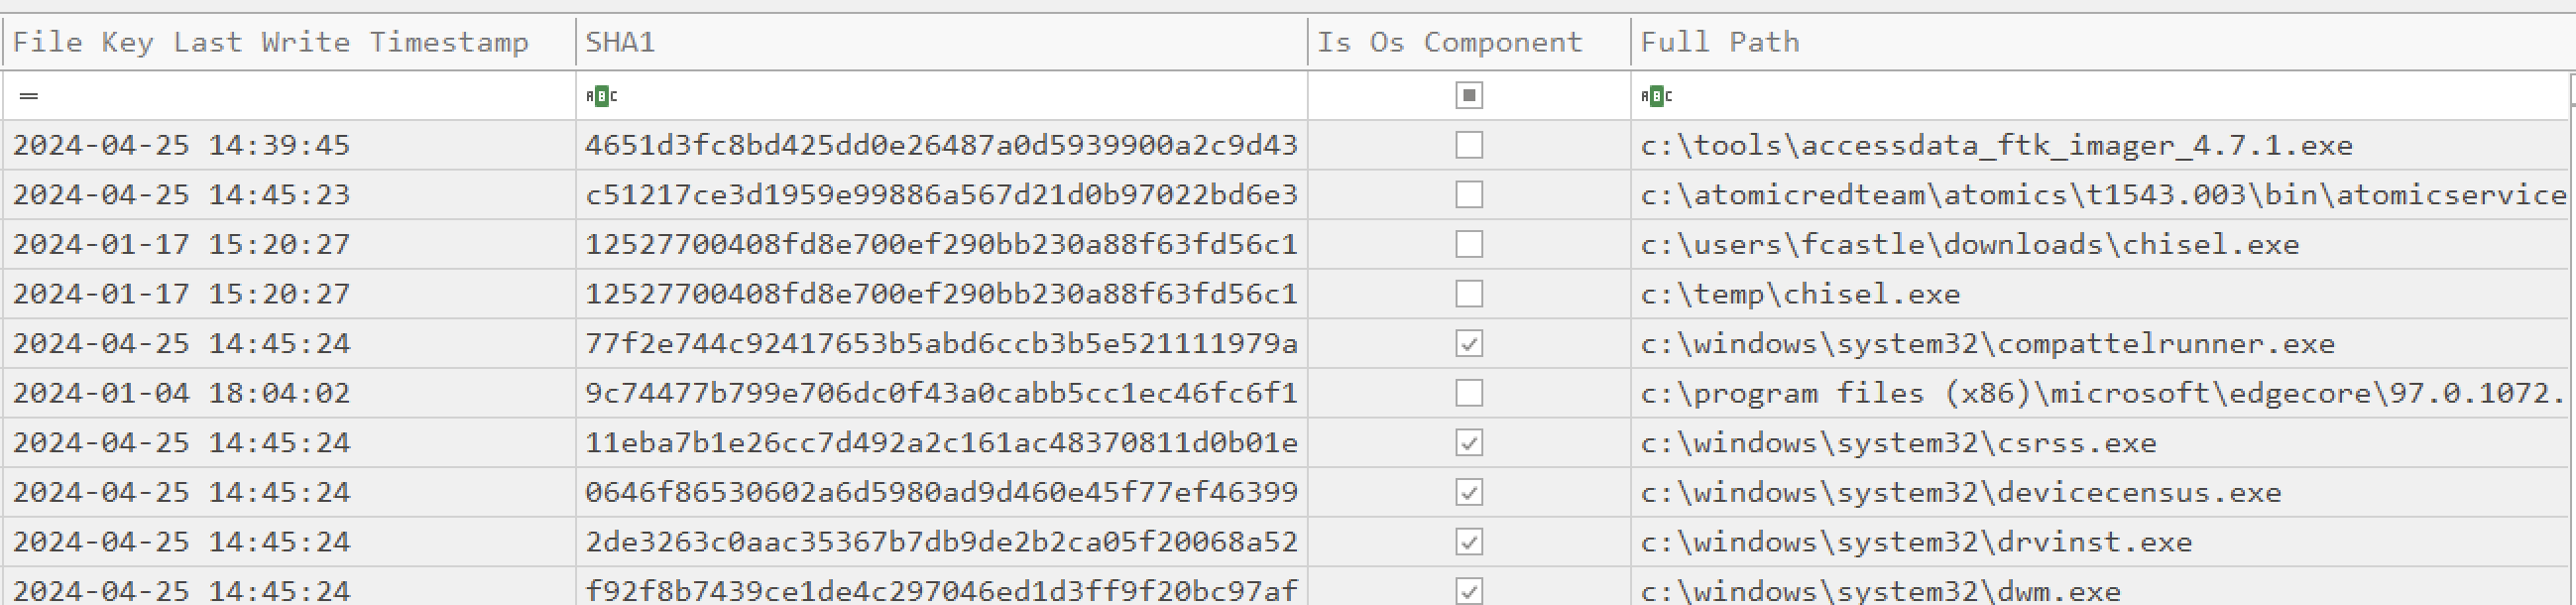
Amcache Analysis
Location: Windows\AppCompat\Programs
# Parse Amcache.hve
AmcacheParser.exe -f c:\cases\e\windows\appcompat\programs\Amcache.hve --csv c:\cases\analysis\execution
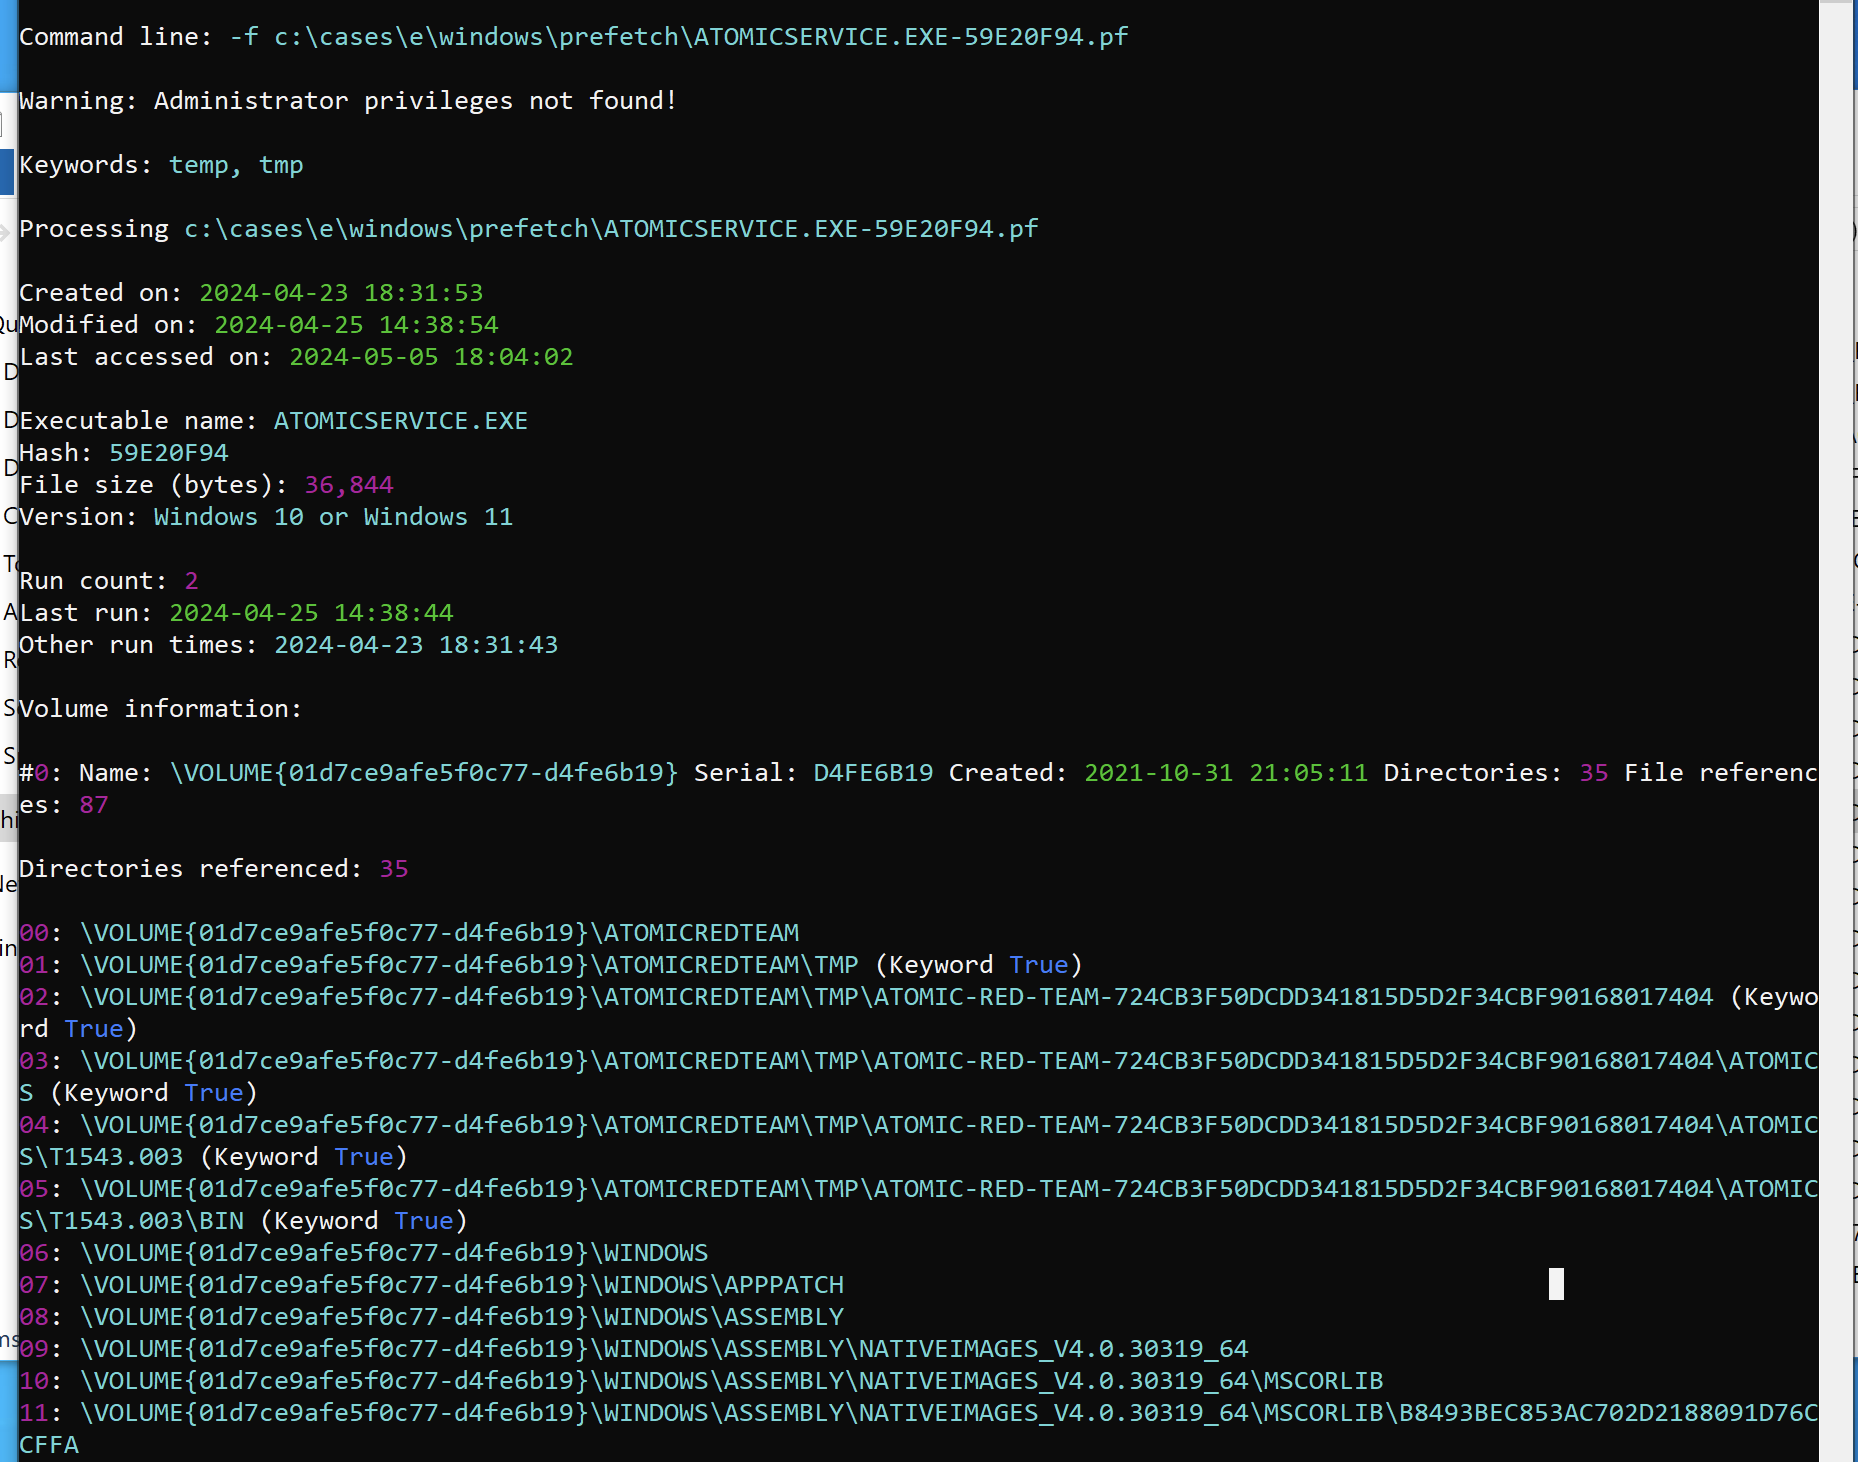
Prefetch Analysis
Location: C:\Cases\E\Windows\prefetch
Single File Analysis:
pecmd.exe -f c:\cases\e\windows\prefetch\ATOMICSERVICE.EXE-59E20F94.pf
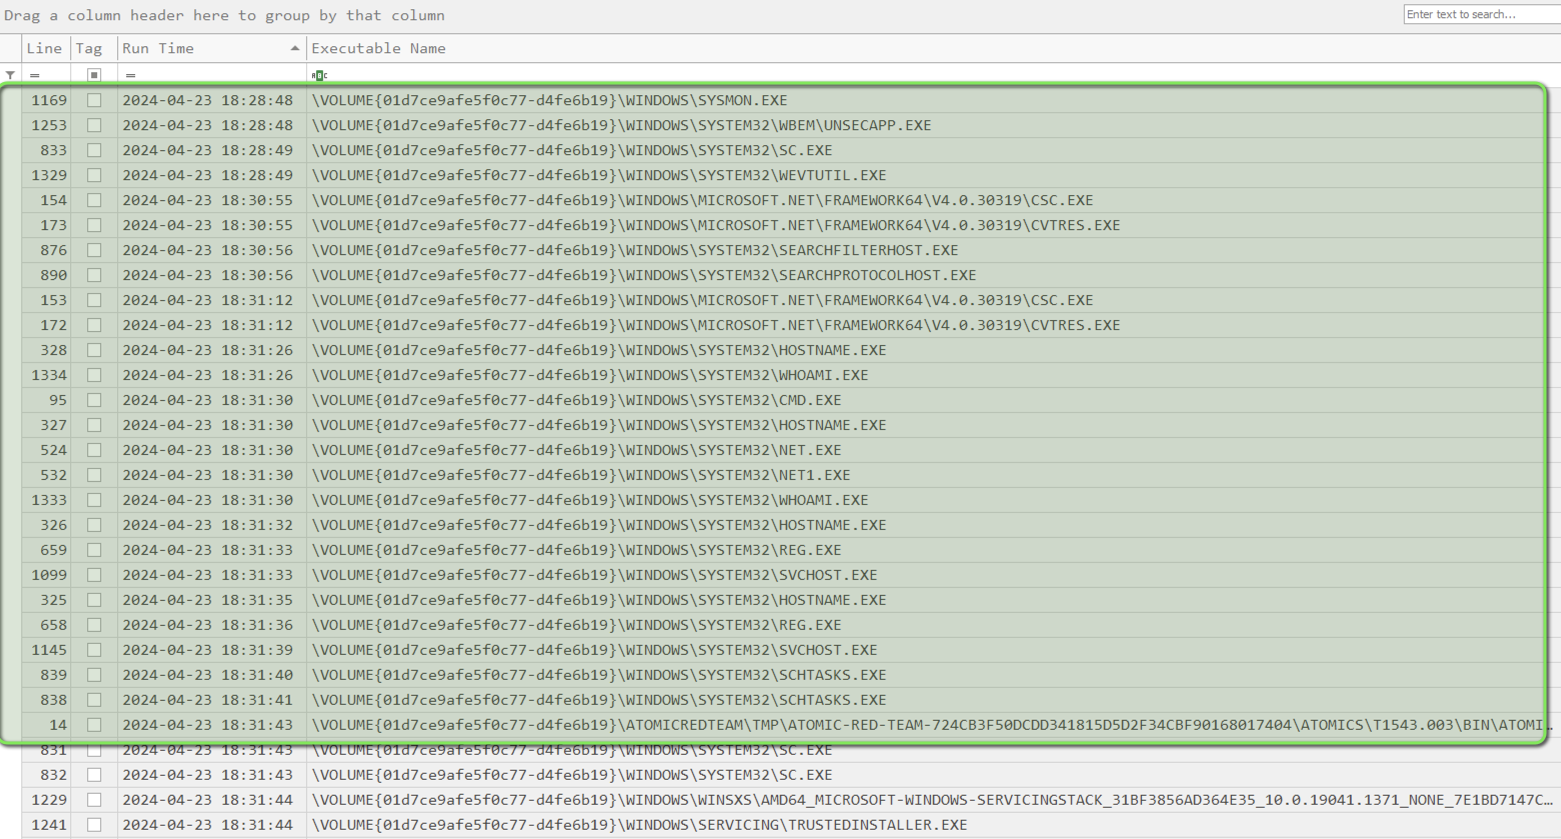
Bulk Analysis:
pecmd.exe -d c:\cases\e\windows\prefetch --csv C:\Cases\Analysis\Execution\
Persistence Analysis
Key Areas of Focus
- Auto-Run Keys
- Scheduled Tasks
- Services
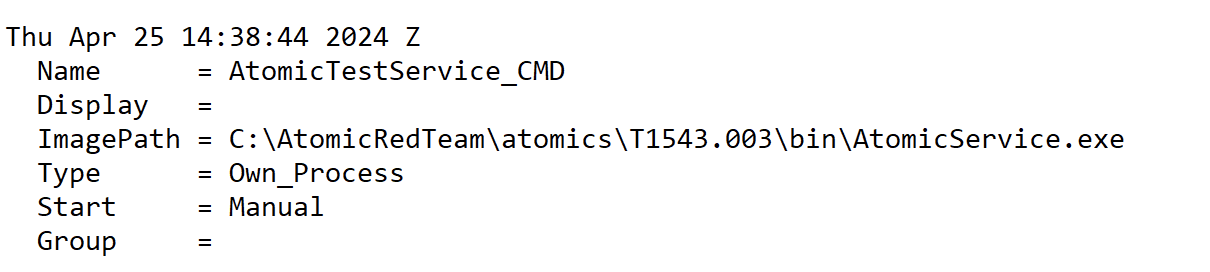
Services Analysis
Search SYSTEM.txt for “services v.” or “svc v.”
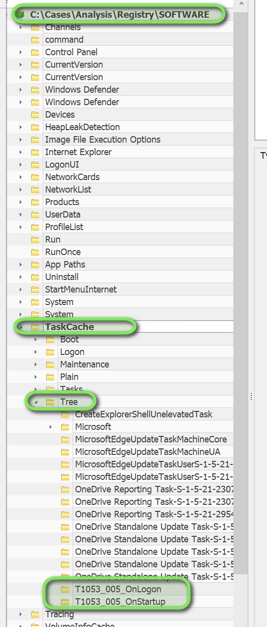
Scheduled Tasks
Location: SOFTWARE hive
Path: Microsoft\Windows NT\CurrentVersion\Scheduler\TaskCache\Tree
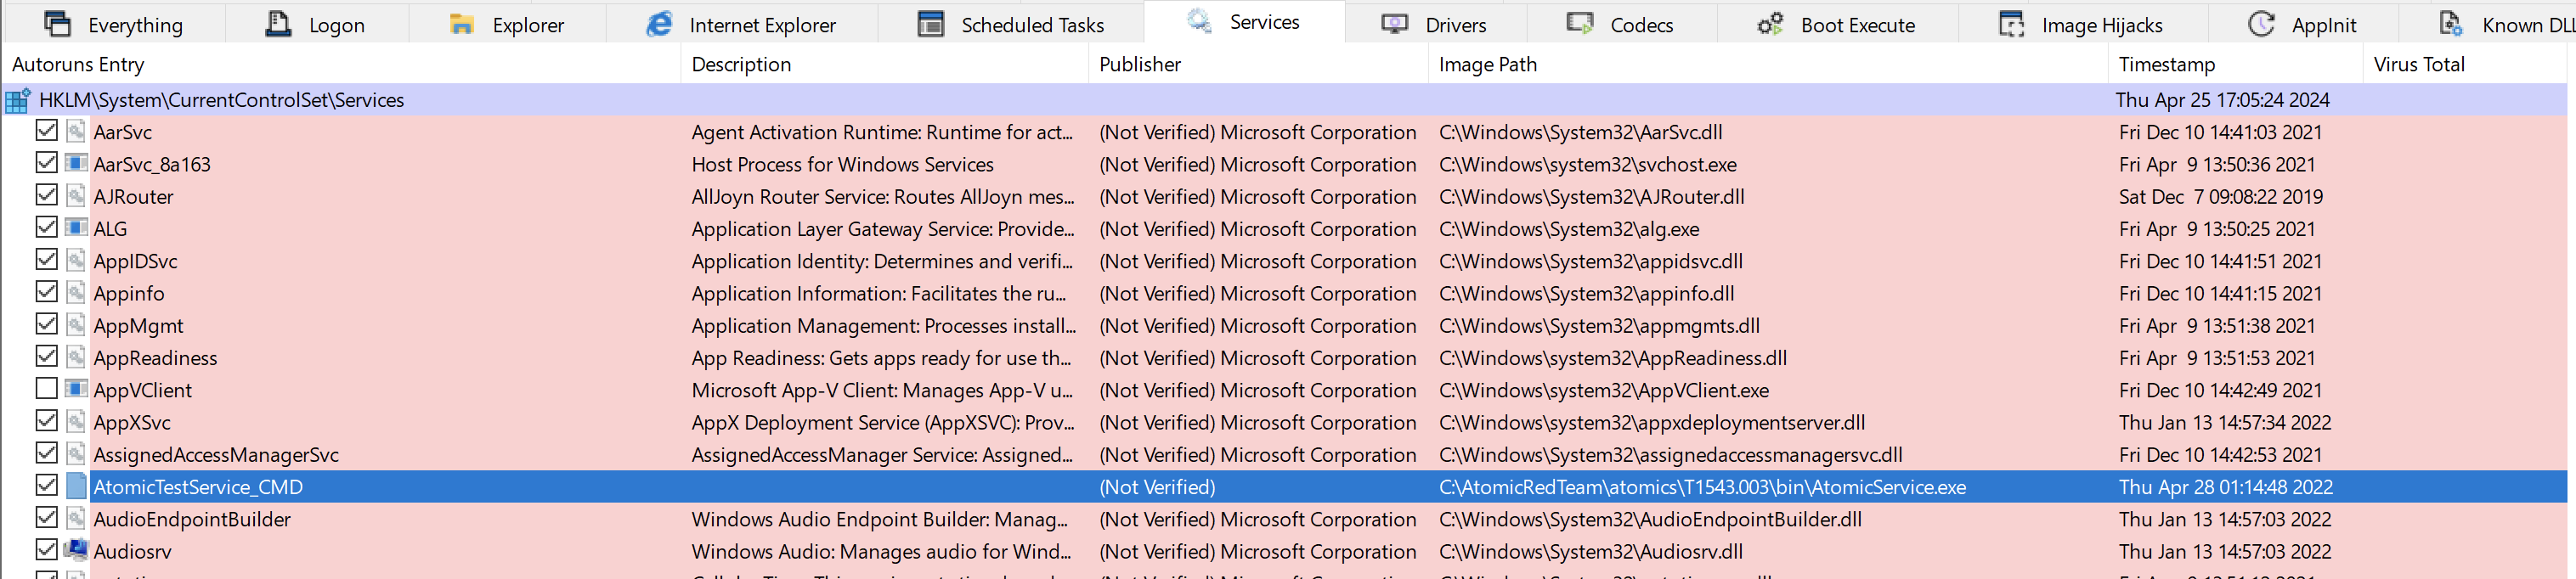
Autoruns Analysis
Tool: SysInternals Autoruns
Method: “Analyze Offline System”
Event Log Analysis
Resources
Analysis Process
Location: Windows\System32\winevent\logs
-
Import logs into Event Log Explorer
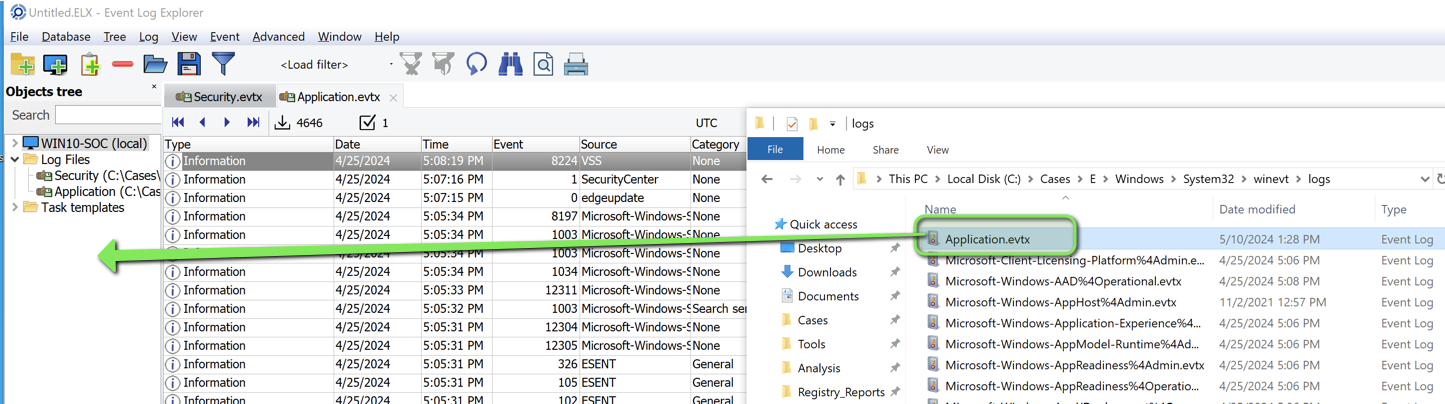
-
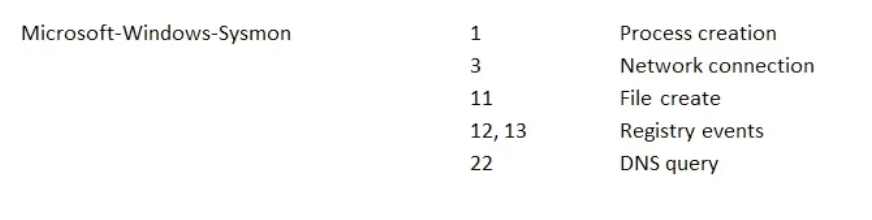
Key Event IDs:
- Service Installation (7045)
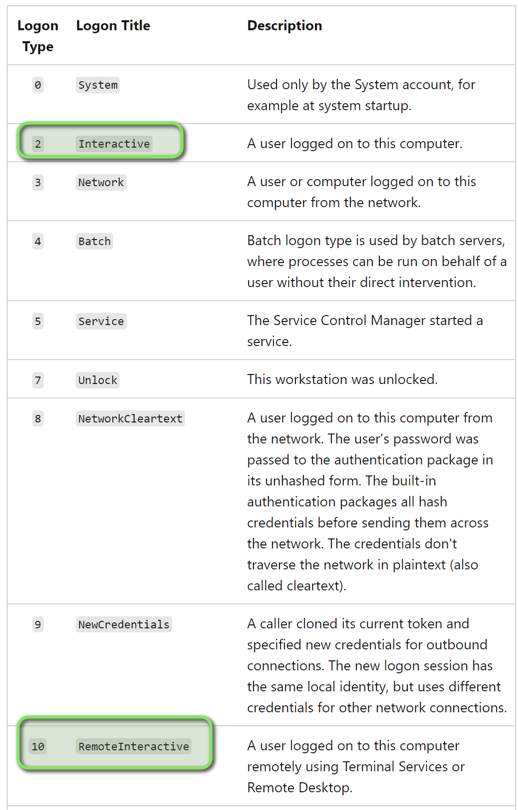
- Logon Events (4624)
- PowerShell Execution (400)
-
Logon Analysis:
-
Sysmon Events: